OSC Staff Notice 45-718 - Ontario’s Exempt Market
OSC Staff Notice 45-718 - Ontario’s Exempt Market
OSC Staff Notice 45-718 -- Ontario's Exempt Market is reproduced on the following internally numbered pages. Bulletin pagination resumes at the end of the Staff Notice.
Ontario's Exempt Market
A review of capital raised in Ontario through prospectus exemptions
OSC Staff Notice 45-718
Fall 2022
Contents
• Executive Summary ................................................................... 2
• Market Composition and Annual Trends ............................... 4
• Investor Trends ........................................................................... 9
• Ontario Issuer Trends .............................................................. 13
Executive Summary
Since 2019, capital raising activity in Ontario's exempt market{1} has continued to grow despite pandemic- related market turbulence. In 2021, the amount of capital raised through prospectus exemptions nearly doubled from pre-pandemic highs to reach a record $175 billion. Much of this increase was driven by significant growth in U.S. and other foreign debt investments. Approximately 98% of the capital raised came from institutional investors. Individual investor activity, which is typically concentrated in Canadian issuers, also increased but at a more moderate pace.
Our findings in this report include:
Issuer and Investor Trends
• In 2021, Canadian and foreign issuers conducting prospectus-exempt offerings raised a total of approximately $171 billion from institutional investors and an additional $4 billion from individual investors.
• As in previous years, Ontario institutional investors primarily invested in debt-related offerings ($113B) of which a large and increasing share was directed at U.S. and other foreign issuers ($78B).
• Investments by individual investors remain concentrated in equity offerings of Canadian issuers (68%).
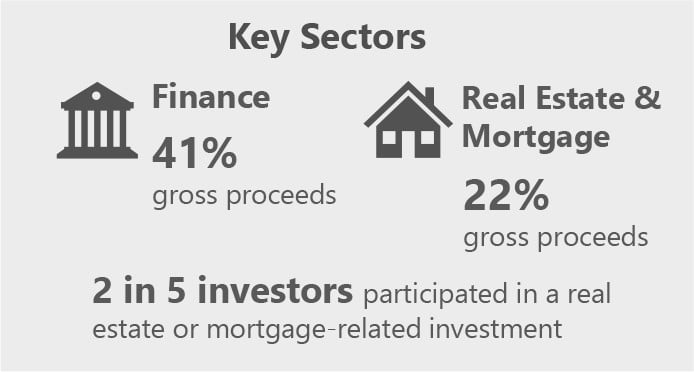
• Real estate and mortgage-related investments continue to attract an increasing share of individual investor capital, growing from approximately 37% in 2019 to 43% in 2021.
Prospectus Exemptions
• The Start-up Crowdfunding Exemption has been used by 59 issuers that have raised an aggregate $1.5 million from Ontario investors since the initial interim class order came into effect in May 2020.{2}
• About a third of the capital raised though the Start-up Crowdfunding Exemption was by issuers in the professional, scientific, and technical services sector.{3}
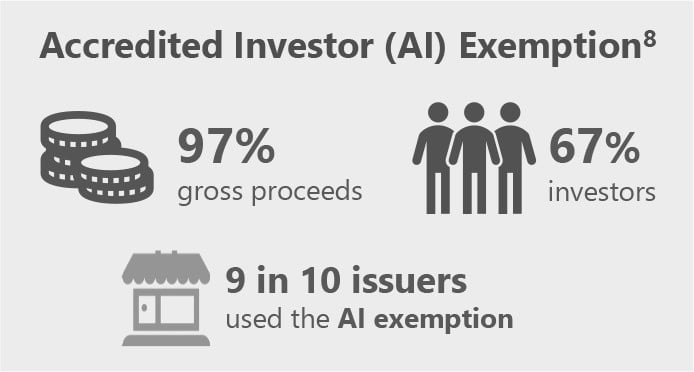
• The Accredited Investor Exemption continues to be the most used prospectus exemption by both Ontario individual (90%) and institutional investors (97%).
Ontario Issuers
• Activity by Ontario-based issuers has increased both in terms of the number of issuers accessing the exempt market and the amount of capital raised.
• In 2021, approximately $270 million was raised from Ontario investors through syndicated mortgage issuances, and about 71% of this ($192M) was raised by Ontario issuers.
• Syndicated mortgage investments represented under 1% of individual capital ($25M) and institutional capital ($245M) invested in 2021.{4}
Background
Purpose
The primary goal of the report is to highlight key annual trends related to exempt market{5} financing activity in Ontario. The report summarizes exempt market activity both in terms of businesses raising capital and the Ontario investors allocating capital to these businesses.
The report discusses the following:
• Market composition and annual trends
• Investor trends
• Ontario issuer trends
Scope and Data
The report relies on information provided in Form 45-106F1 Report of Exempt Distributions ("F1 Report") and the accompanying Schedule 1 filed with the OSC. The scope of the report is limited to non-investment fund issuers that raised capital in 2020 and 2021 from Ontario investors under prospectus exemptions that trigger a requirement to file an F1 Report.{6} These include distributions by both Canadian and foreign issuers. Therefore, the information presented in this report does not represent all exempt market or private market financing activity, such as distributions made under the private issuer exemption.
The data in this report was collected at a point in time and may not incorporate the latest filer amendments or late filings. Similarly, this report may include updated historical figures that differ from previously reported numbers as historical data has now incorporated such filings.
For the period analyzed, approximately 1% of F1 Report filings were excluded because they contained data errors, incomplete records or were identified as duplicate filings. In addition, OSC staff relied on various data cleaning methods and conducted additional research to identify market segments that were not explicitly captured in the F1 Report. For example, issuers were categorized into one of three mortgage sub-segments (Mortgage Investment Entities, Mortgage Syndication or Other Mortgage) based on a combination of OSC staff's research, issuer's name, issuer's NAICS sector, type of securities distributed and additional issuer information.
Market Composition and Annual Trends
Market Composition in 2021
The composition of Ontario's exempt market remains largely unchanged compared to 2019. Institutional investments in foreign, predominantly U.S.-based issuers continue to account for the majority of capital raised. However, for the first time, the number of foreign-based issuers raising capital from Ontario investors was greater than the number of Canadian issuers.
Capital Source
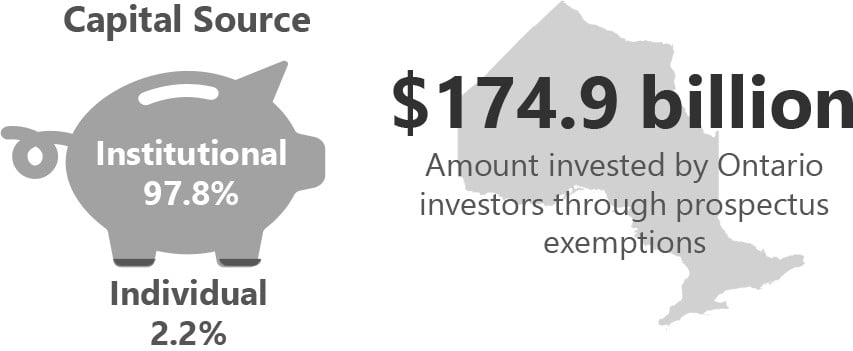
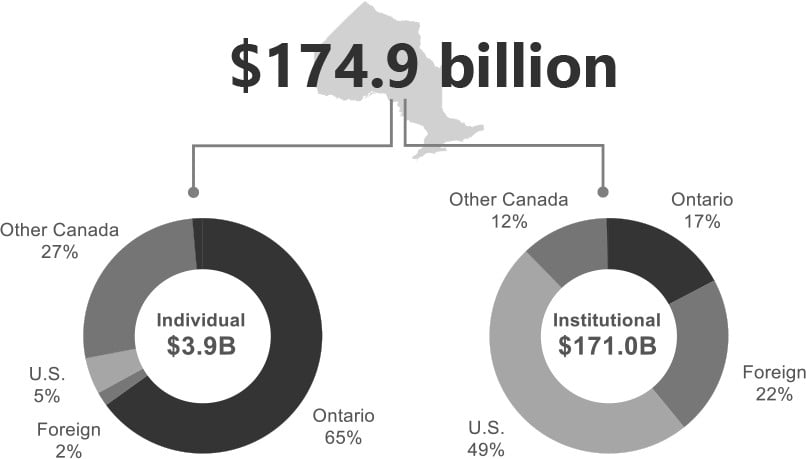
$174.9 billion
Amount invested by Ontario investors through prospectus exemptions
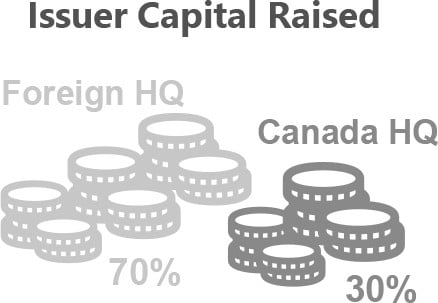
Issuer Capital Raised


Other Key Components
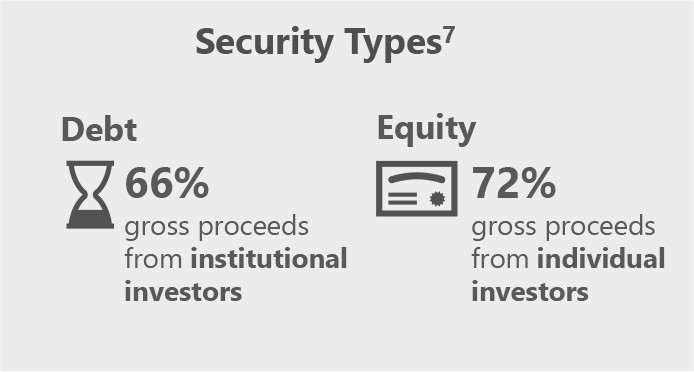
Security Types{7}
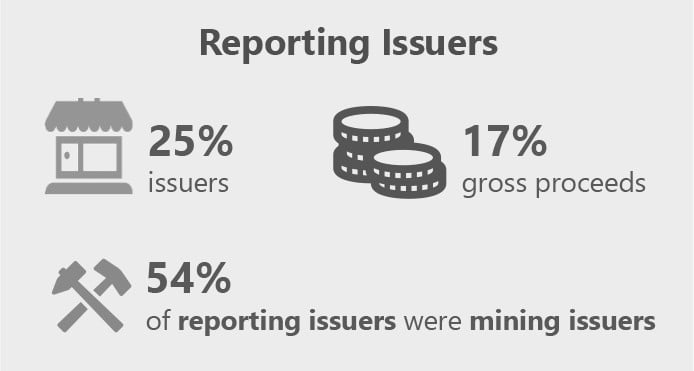
Reporting Issuers
Key Sectors
Accredited Investor (AI) Exemption{8}
Annual Trends
Ontario's exempt market has grown significantly since 2018 across both institutional and individual investor market segments. There was a small decline in the amount of capital raised from individual investors in 2020 but overall activity, both in terms of the numbers of issuers and investors, has continued to rise.
Capital Raised
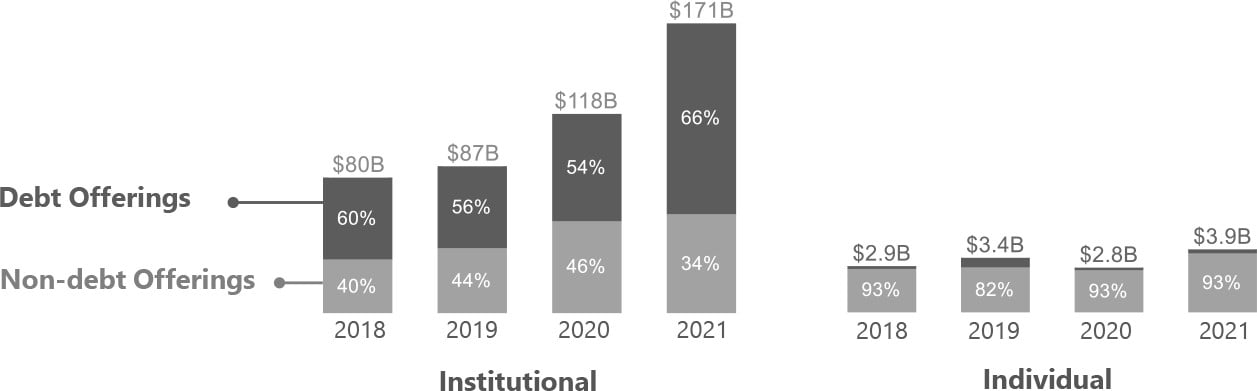
Growth in capital raising activity over the years has been concentrated in the institutional investor segment. Since 2018, the amount of capital invested by institutional investors through prospectus- exempt offerings has more than doubled. Much of this increase was through debt-related offerings of U.S.-based and other foreign issuers. In contrast, capital investment by individual investors, which continues to be concentrated in non-debt-related offerings of Canadian issuers, grew at a more moderate pace.
Capital Raised by Security Type
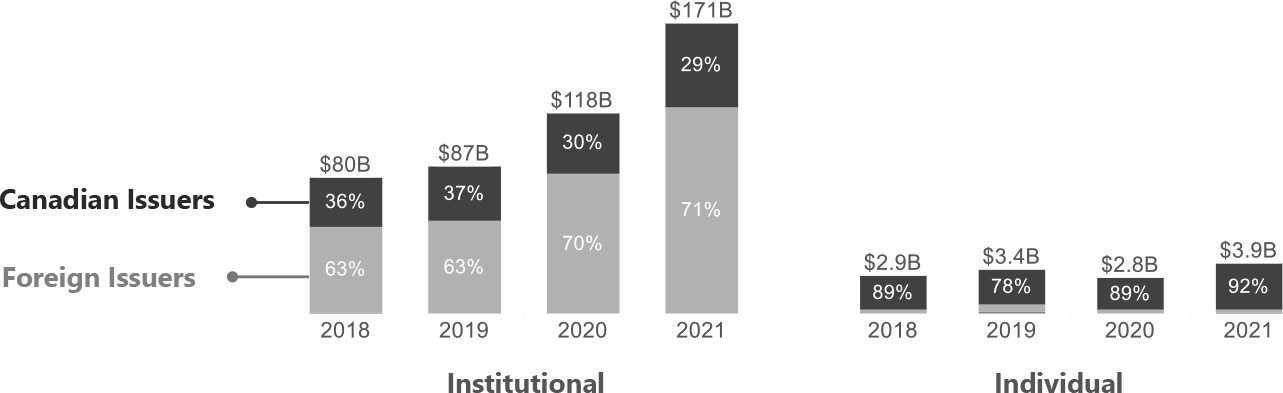
Capital Raised by Issuer Headquarters
Issuers
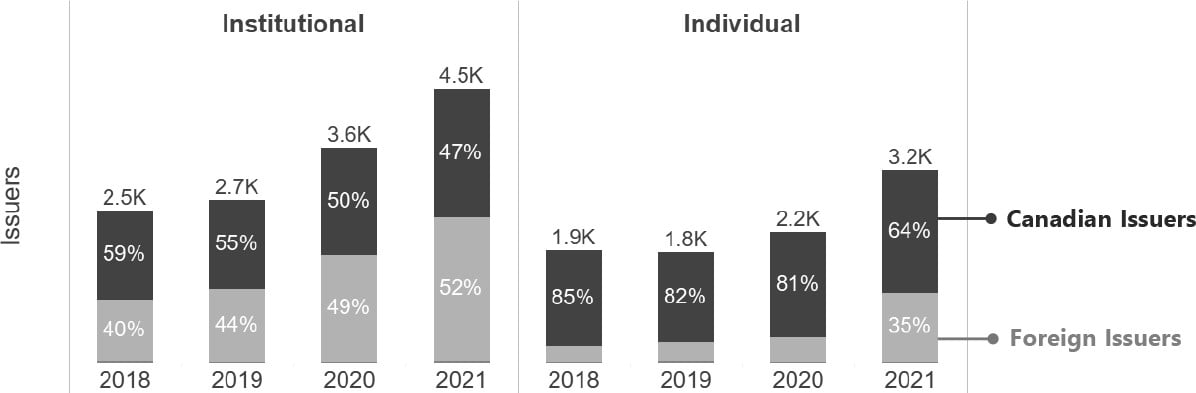
The number of Canadian and foreign issuers raising capital from Ontario investors through the exempt market has continued to increase.
In 2021, out of the approximately 4,500 issuers that raised capital from institutional investors, approximately 52% were foreign issuers.{9} Within the individual investor segment, Canadian issuers still outnumbered foreign issuers. Of the 3,200 issuers that raised capital from individual investors in 2021, 64% were Canadian-based issuers. However, in 2021, there was a notable uptick in the number of U.S.- based issuers raising capital from individual investors.
Investors
After a minor decline in 2020, the number of Ontario investors participating in prospectus-exempt distributions rebounded in 2021. There were approximately 36,100 individual investors and 9,400 institutional investors accessing the Ontario exempt market, representing a 26% and 36% increase, respectively, since 2019.
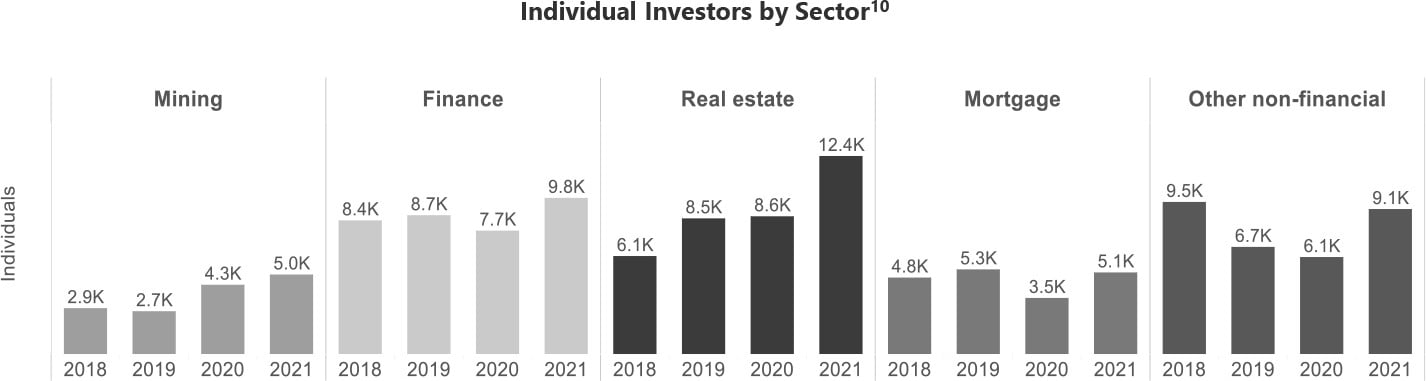
Real estate, finance, mortgage and mining sectors continue to attract the largest share of individual investors. Since 2019, mining and real estate sectors also experienced the largest percentage gain in the number of individual investors.
Individual Investors by Sector{10}
Prospectus Exemptions
Activity under both the Offering Memorandum (OM) Exemption and Family, Friends and Business Associates (FFBA) Exemption has continued to increase. There has also been some activity under the recently harmonized Start-up Crowdfunding Exemption, which was initially adopted under interim class orders starting in May 2020 before a rule was adopted in September 2021.
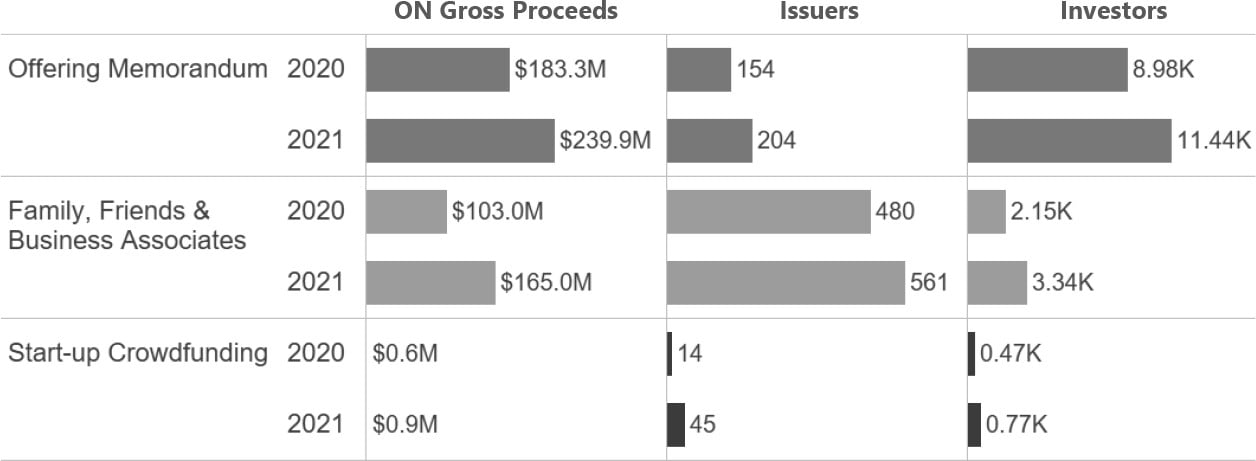
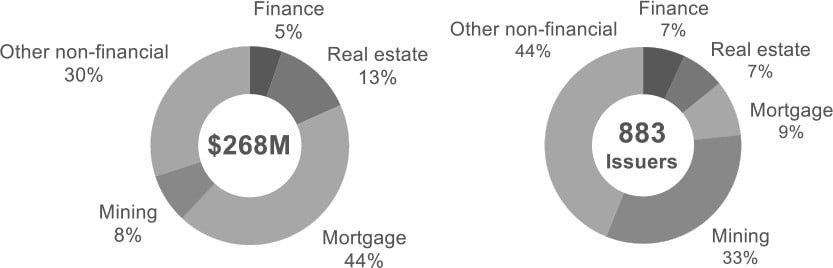
During 2020 and 2021, the OM Exemption continued to be predominantly used by mortgage and real estate issuers.{11}
Offering Memorandum Exemption (2020 & 2021)
The greatest proportion of issuers relying on the FFBA Exemption has been non-financial issuers, especially mining issuers.{12} However, mortgage issuers raised more capital under the exemption than issuers in other sectors.
Family, Friends & Business Associates Exemption (2020 & 2021)
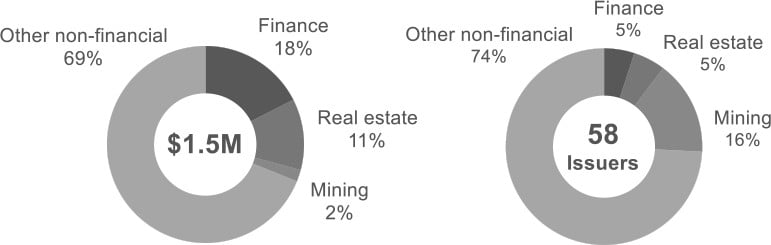
The Start-up Crowdfunding Exemption has been predominantly used by non-financial issuers, mainly issuers in the professional, scientific, and technical sector (32%), and the manufacturing sector (18%).
Start-up Crowdfunding Exemption (2020 & 2021)
Investor Trends
Investor Trends
Where did investors allocate capital in 2021?
Issuer HQ
Individual investors allocated most of their capital to Ontario-based issuers, whereas institutional investors allocated more capital to foreign-based issuers, predominantly those based in the U.S.
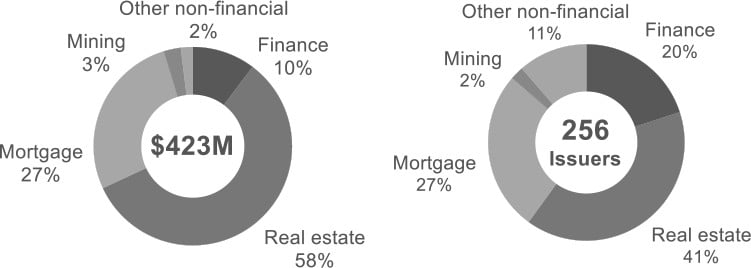
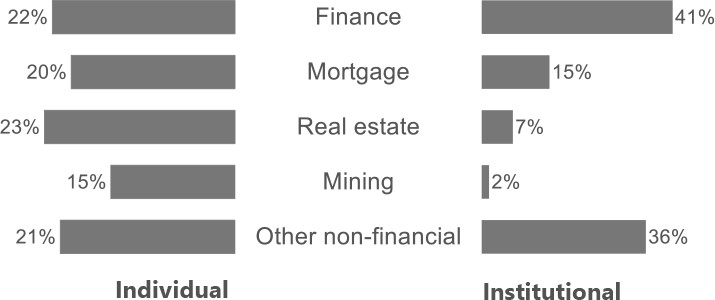
Key Sectors
Finance, mortgage and real estate investments accounted for almost two- thirds of the capital invested by individual investors. In contrast, institutional investments were largely concentrated in the finance sector (41%).
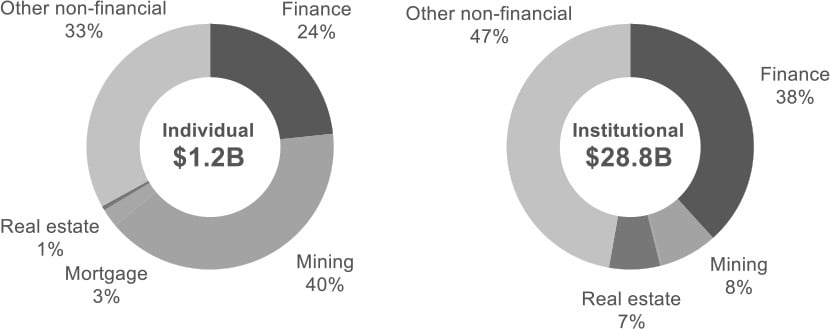
Reporting Issuers
Reporting issuers received 31% of capital invested in the exempt market by individual investors ($1.2B) and 17% of capital invested by institutional investors ($28.8B).
For individual investors, investments in reporting issuers were concentrated in the mining (40%) and finance (24%) sectors.
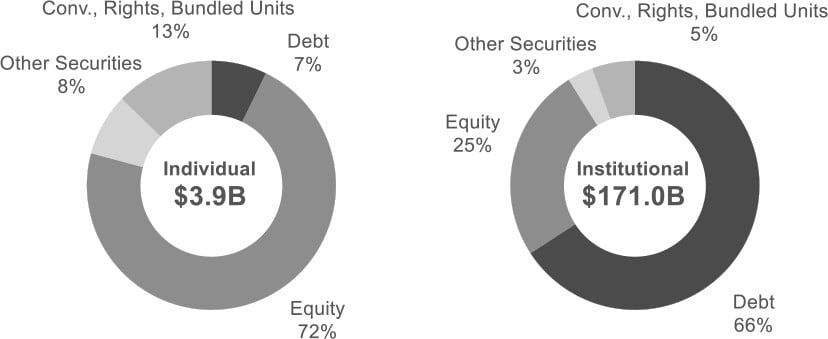
Security Types{13}
The majority of capital invested by individual investors in 2021 was in equity securities. Institutional investors were more likely to invest in debt securities.
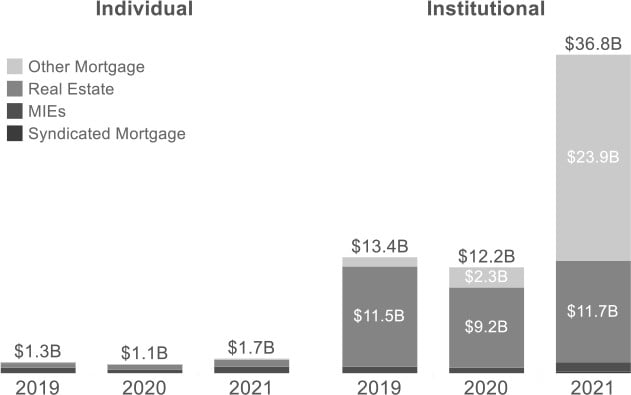
Mortgage and Real Estate Investments
Mortgage and real estate investments have increased for both institutional and individual investors since 2019.
In 2021, a large investment in a U.S. government sponsored mortgage-backed security issuer contributed to the three-fold increase in institutional capital invested in this sector.
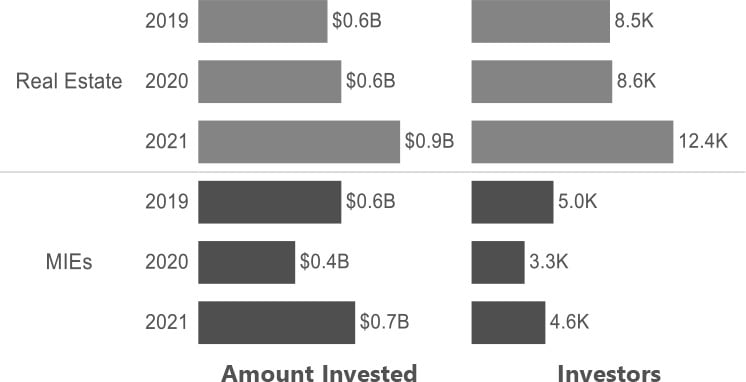
Individual investments in mortgage investment entities (MIEs) rebounded in 2021 and there was a notable increase in real estate investments since 2019.
In 2021, approximately $270 million was invested in syndicated mortgages, with $245 million invested by institutional investors and $25 million invested by individual investors.
As in previous years, most of the capital invested in mortgage and real estate issuers by individuals was through offerings of equity securities (97%). In contrast, approximately 80% of the institutional investor capital invested in mortgage and real estate issuers was in debt securities.
Annual Investment in Real Estate and Mortgage Sub-segments{14}
Individual Investments in Real Estate and MIEs
Prospectus Exemptions
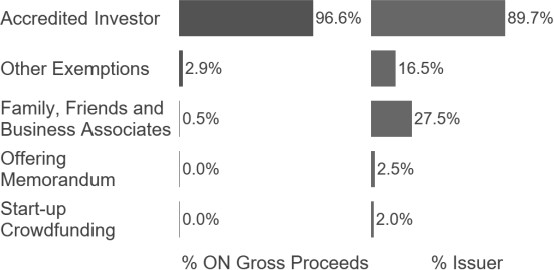
In 2021, the AI Exemption continues to be the most used exemption for individuals (90%) and institutional (97%) investors.
Amount Invested by Prospectus Exemption
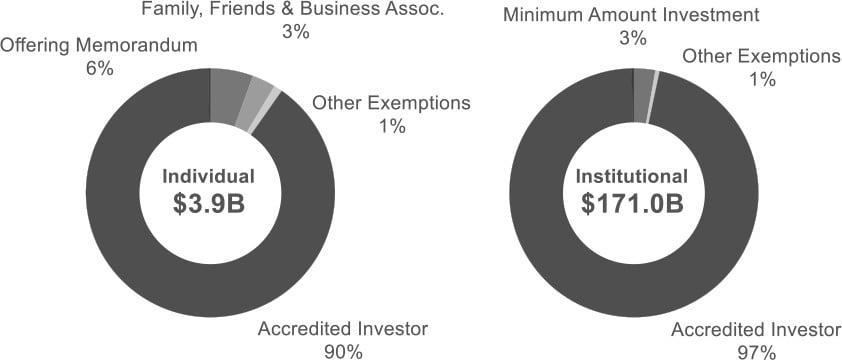
After the AI Exemption, the OM Exemption was the second most used prospectus exemption for individual investors in 2021.
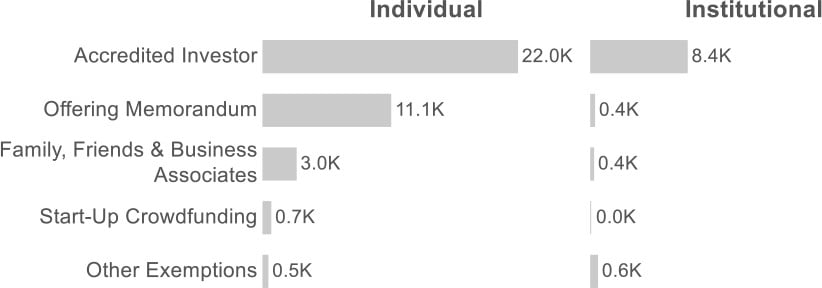
Number of Investors by Prospectus Exemption
Individual Investors
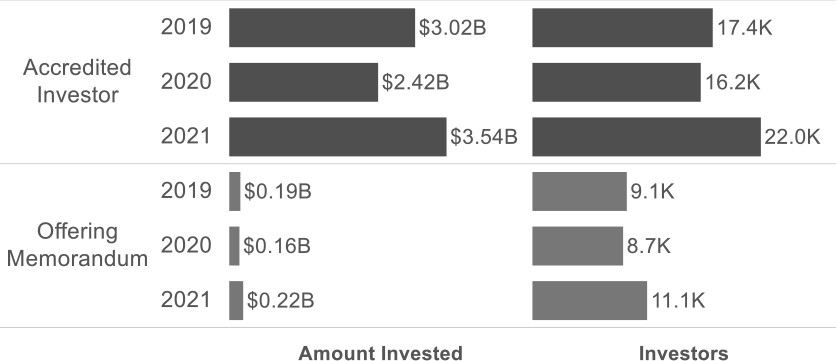
In 2021, individual investor activity under the AI Exemption and OM Exemption surpassed 2019 levels.
AI and OM Activity by Individual Investors
Ontario Issuer Trends
Ontario Issuers in 2021
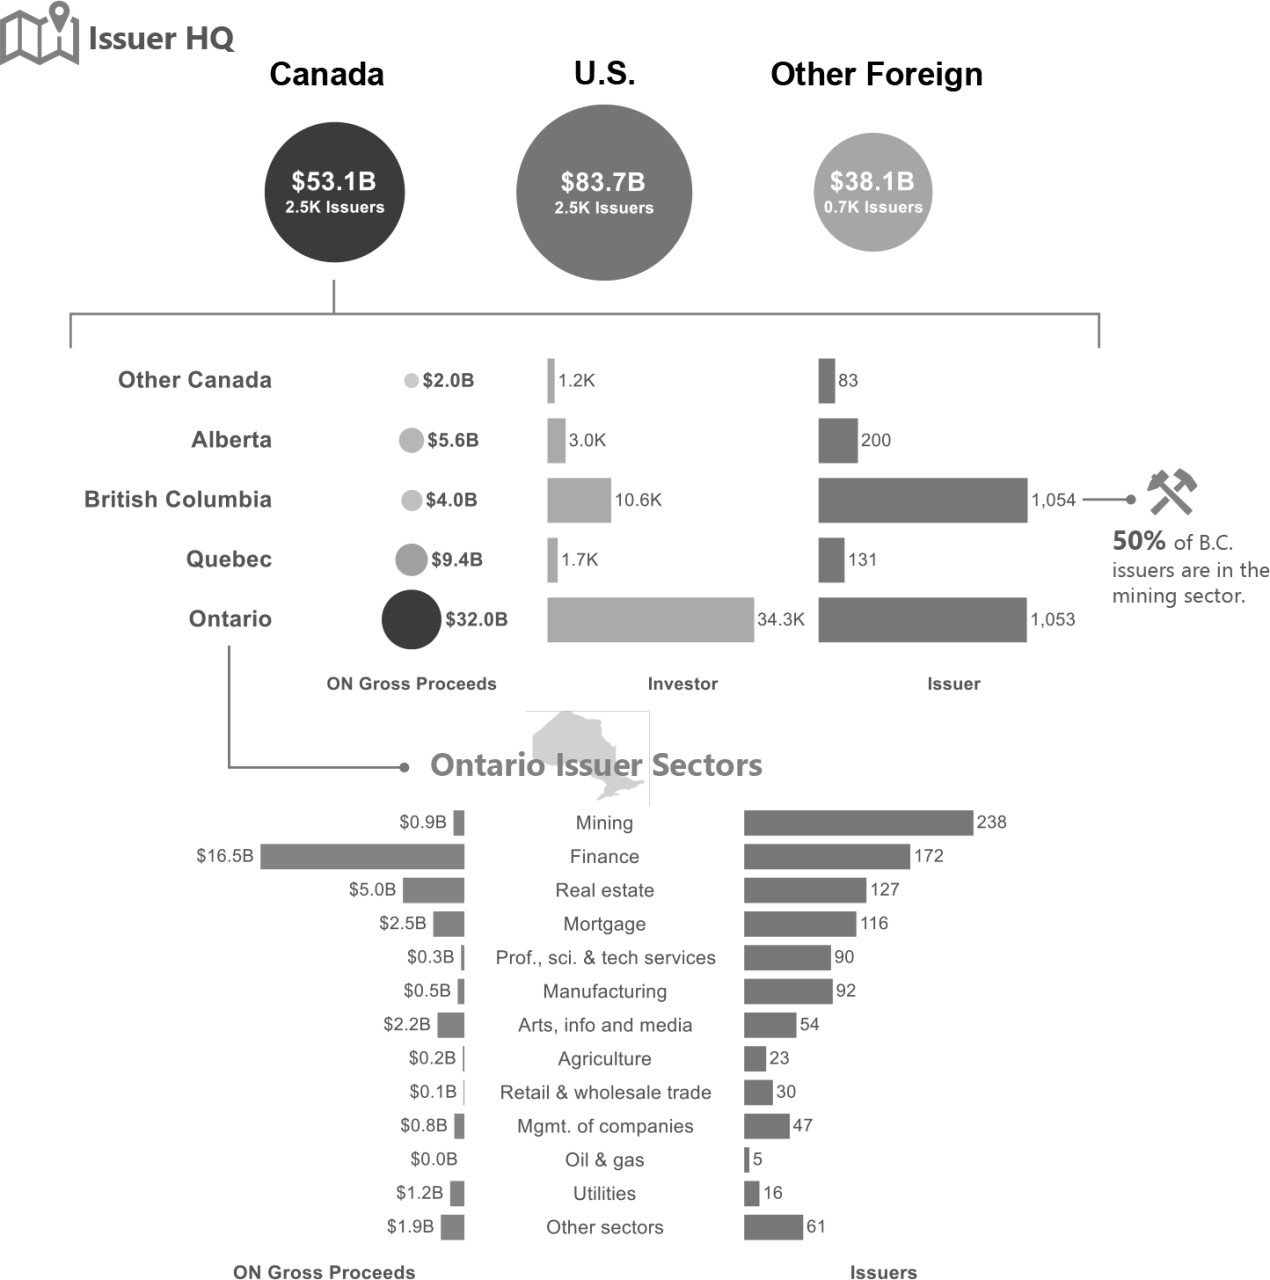
Since 2019, the amount of capital raised by Canadian issuers has increased by approximately 56%, whereas the amount raised by U.S. issuers has more than doubled over the same period. Ontario- based issuers still account for over half (approximately 60%) of the capital raised by Canadian issuers. The sector composition of Ontario-based issuers accessing exempt market financings remains generally unchanged between 2019 and 2021.{15}
Issuer HQ
Key Ontario Sectors -- Financial Issuers
Issuers in the finance sector continue to comprise a large share of the capital raised by Ontario-based issuers.
Ontario Issuer Activity
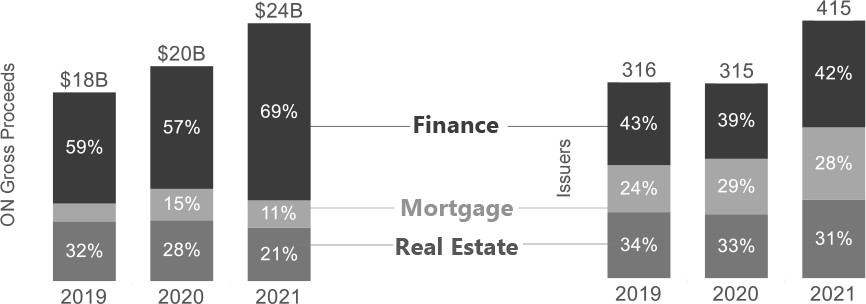
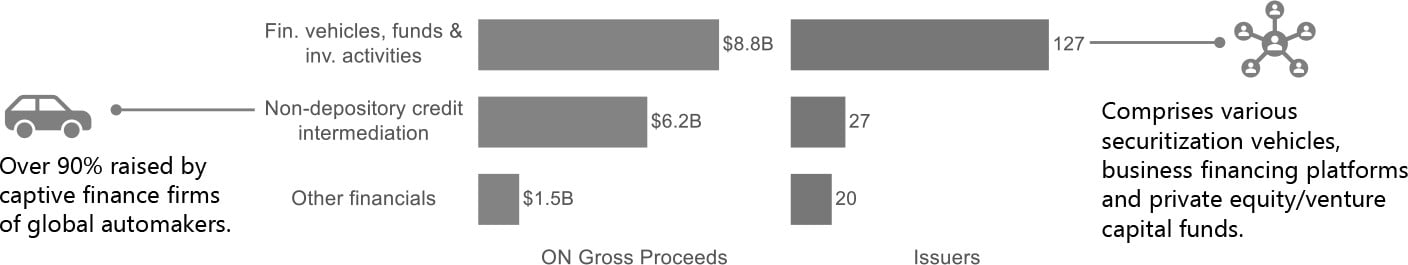
Finance
2021 Finance Subsector/Industry
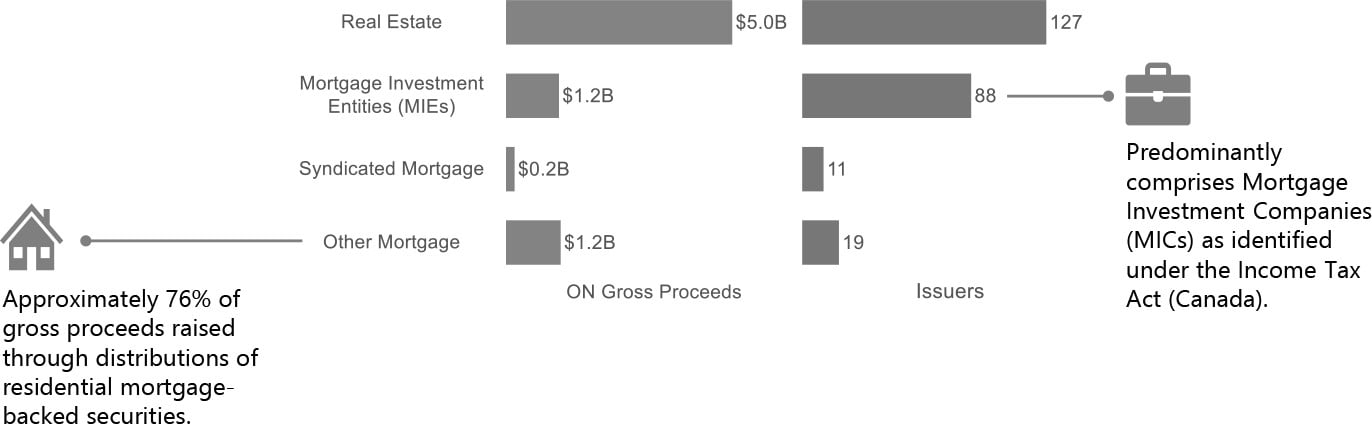
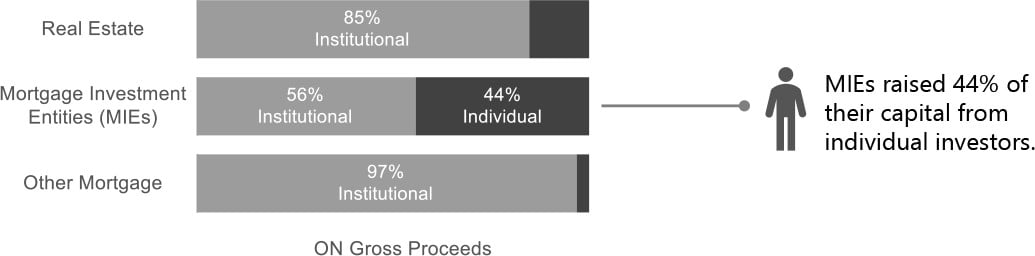
Mortgage and Real Estate
2021 Issuer Composition
2021 Investor Composition
Key Ontario Sectors -- Non-Financial Issuers
Ontario Non-Financial Issuer Activity
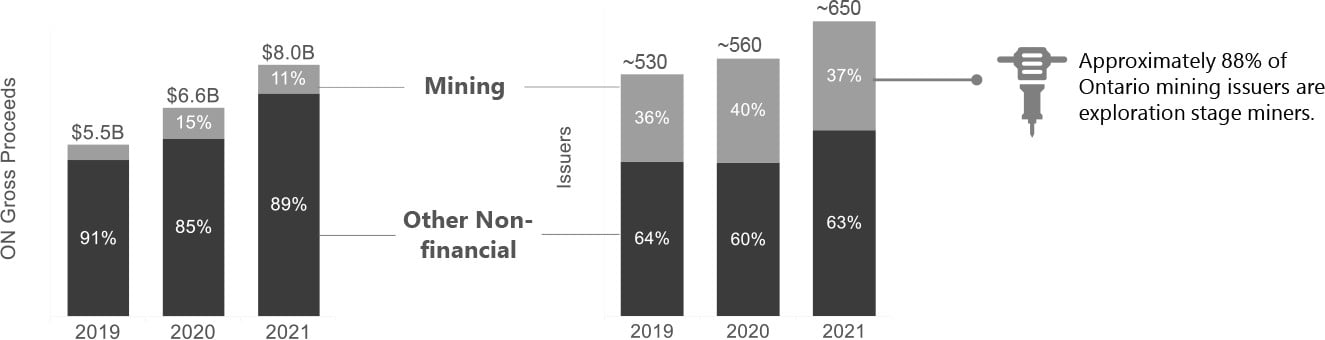
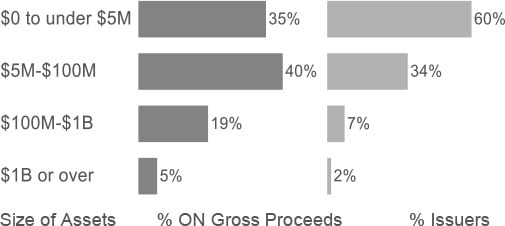
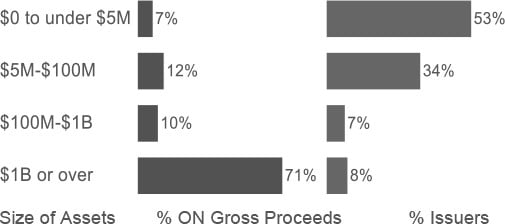
Issuer's Asset Size{16}
Over half of all non- financial issuers had less than $5 million in total assets in 2021.
Mining Issuer Size
Other Non-Financial Issuer Size
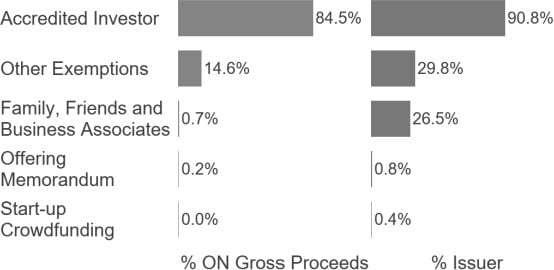
Prospectus Exemption{17}
Ontario mining and other non-financial issuers predominantly used the AI Exemption to raise capital.
Mining{18}
Other Non-Financial
Contacts
Please refer your questions to the following OSC staff:
Jiayi ChengResearch Analyst, Regulatory Strategy and Research Ontario Securities Commission416-263-7720Tamara DriscollSenior Accountant, Corporate Finance Ontario Securities Commission416-596-4292Erin O'DonovanManager (Acting), Corporate Finance Ontario Securities Commission416-204-8973Kevin YangManager, Regulatory Strategy and Research Ontario Securities Commission416-204-8983
{1} For the purpose of this report, "individual investors" refers to investors who were identified by their full legal name and not a corporate or legal entity name. "Institutional investors" refers to non-individuals such as companies, trusts or managed accounts purchasing on behalf of a beneficiary or group of beneficiaries.
{2} Activity as of December 2021 includes distributions reported under National Instrument 45-110 Start-Up Crowdfunding Registration and Prospectus Exemptions, Ontario Instrument 45-505 Relief in respect of the Distribution of Securities through a Funding Portal Operated by Silver Maple Ventures Inc. (Interim Class Order), and Ontario Instrument 45-506 Start-Up Crowdfunding Registration and Prospectus Exemptions (Interim Class Order). See CSA Notice of Publication of National Instrument 45-110 and OSC Staff Notice 45-505 for more information.
{3} Issuer sector categories were based on their reported NAICS (North American Industry Classification System) code with the exception of mortgage and real estate issuers, which were identified based on additional OSC staff research.
{4} On July 1, 2021, amendments to National Instrument 45-106 Prospectus Exemptions, National Instrument 31-103 Registration Requirements, Exemptions and Ongoing Registrant Obligations, and OSC Rule 45-501 Ontario Prospectus and Registration Exemptions related to syndicated mortgages came into force.
{5} For more information about the exempt market, please see: "The Exempt Market at <http://www.osc.gov.on.ca/en/exempt-market.htm> and "The Exempt Market Explained" at <https://www.getsmarteraboutmoney.ca>.
{6} For more information on which exemptions require the filing of an F1 Report in Ontario, see Part 6: Reporting Requirements of National Instrument 45- 106 Prospectus Exemptions.
{7} Equity includes all classes of common shares, preferred shares, flow-through shares, partnership units, depository receipts and subscription receipts. Debt securities include notes, debentures, bonds, and certificates.
{8} See definition of "accredited investor" in Part 1: Definitions and Interpretation of National Instrument 45-106 Prospectus Exemptions.
{9} Issuer headquarter (HQ) information is not reported for about 1% of issuers that submitted filings in 2018 to 2021.
{10} Annual number of investors that invested capital in issuers in each sector. Some investors may have invested in issuers in multiple sectors.
{11} The number of issuers in the pie charts indicate total distinct issuers from 2020 to 2021.
{12} Non-financial issuers consist of issuers in a NAICS sector other than the finance sector that were not identified as a real estate or mortgage issuer by OSC staff's categorization.
{13} Equity securities include all classes of common shares, preferred shares, flow-through shares, partnership units, depository receipts and subscription receipts. Debt securities include notes, debentures, bonds, and certificates. "Other Securities" include all other security types and for distributions where the security type was not reported.
{14} Issuers categorized under MIEs are predominantly mortgage investment corporations or similarly structured entities; Real Estate includes real estate investment trusts (REITS); Other Mortgage comprises all other mortgage-related investments such as mortgage-backed securities.
{15} This section focuses on Ontario issuers that raised capital from Ontario investors under prospectus exemptions that trigger a requirement to file an F1 Report.
{16} Based on the reported size of issuer's assets from recently available annual financial statements or the size of issuer's assets at the time of distribution end date.
{17} Other Exemptions consists of seven reportable prospectus exemption types, including the Minimum Amount Investment Exemption, Asset Acquisition Exemption, Crowdfunding Exemption, Petroleum, Natural Gas and Mining Properties Exemption, Securities for Debt Exemption, Isolated Distribution by Issuer Exemption, and Existing Security Holder Exemption.
{18} The total percentage of issuers by exemption will exceed 100% since some issuers rely on multiple prospectus exemptions to raise capital. For example, 90% (or 9 in 10) non-financial issuers relied on the AI Exemption and 30% (or 3 in 10) non-financial issuers relied on the FFBA Exemption.