CSA Multilateral Staff Notice - Review of Disclosure Regarding Women on Boards and in Executive Officer Positions
CSA Multilateral Staff Notice - Review of Disclosure Regarding Women on Boards and in Executive Officer Positions
CSA Multilateral Staff Notice 58-313 Review of Disclosure Regarding Women on Boards and in Executive Officer Positions
Year 7 Report
November 4, 2021
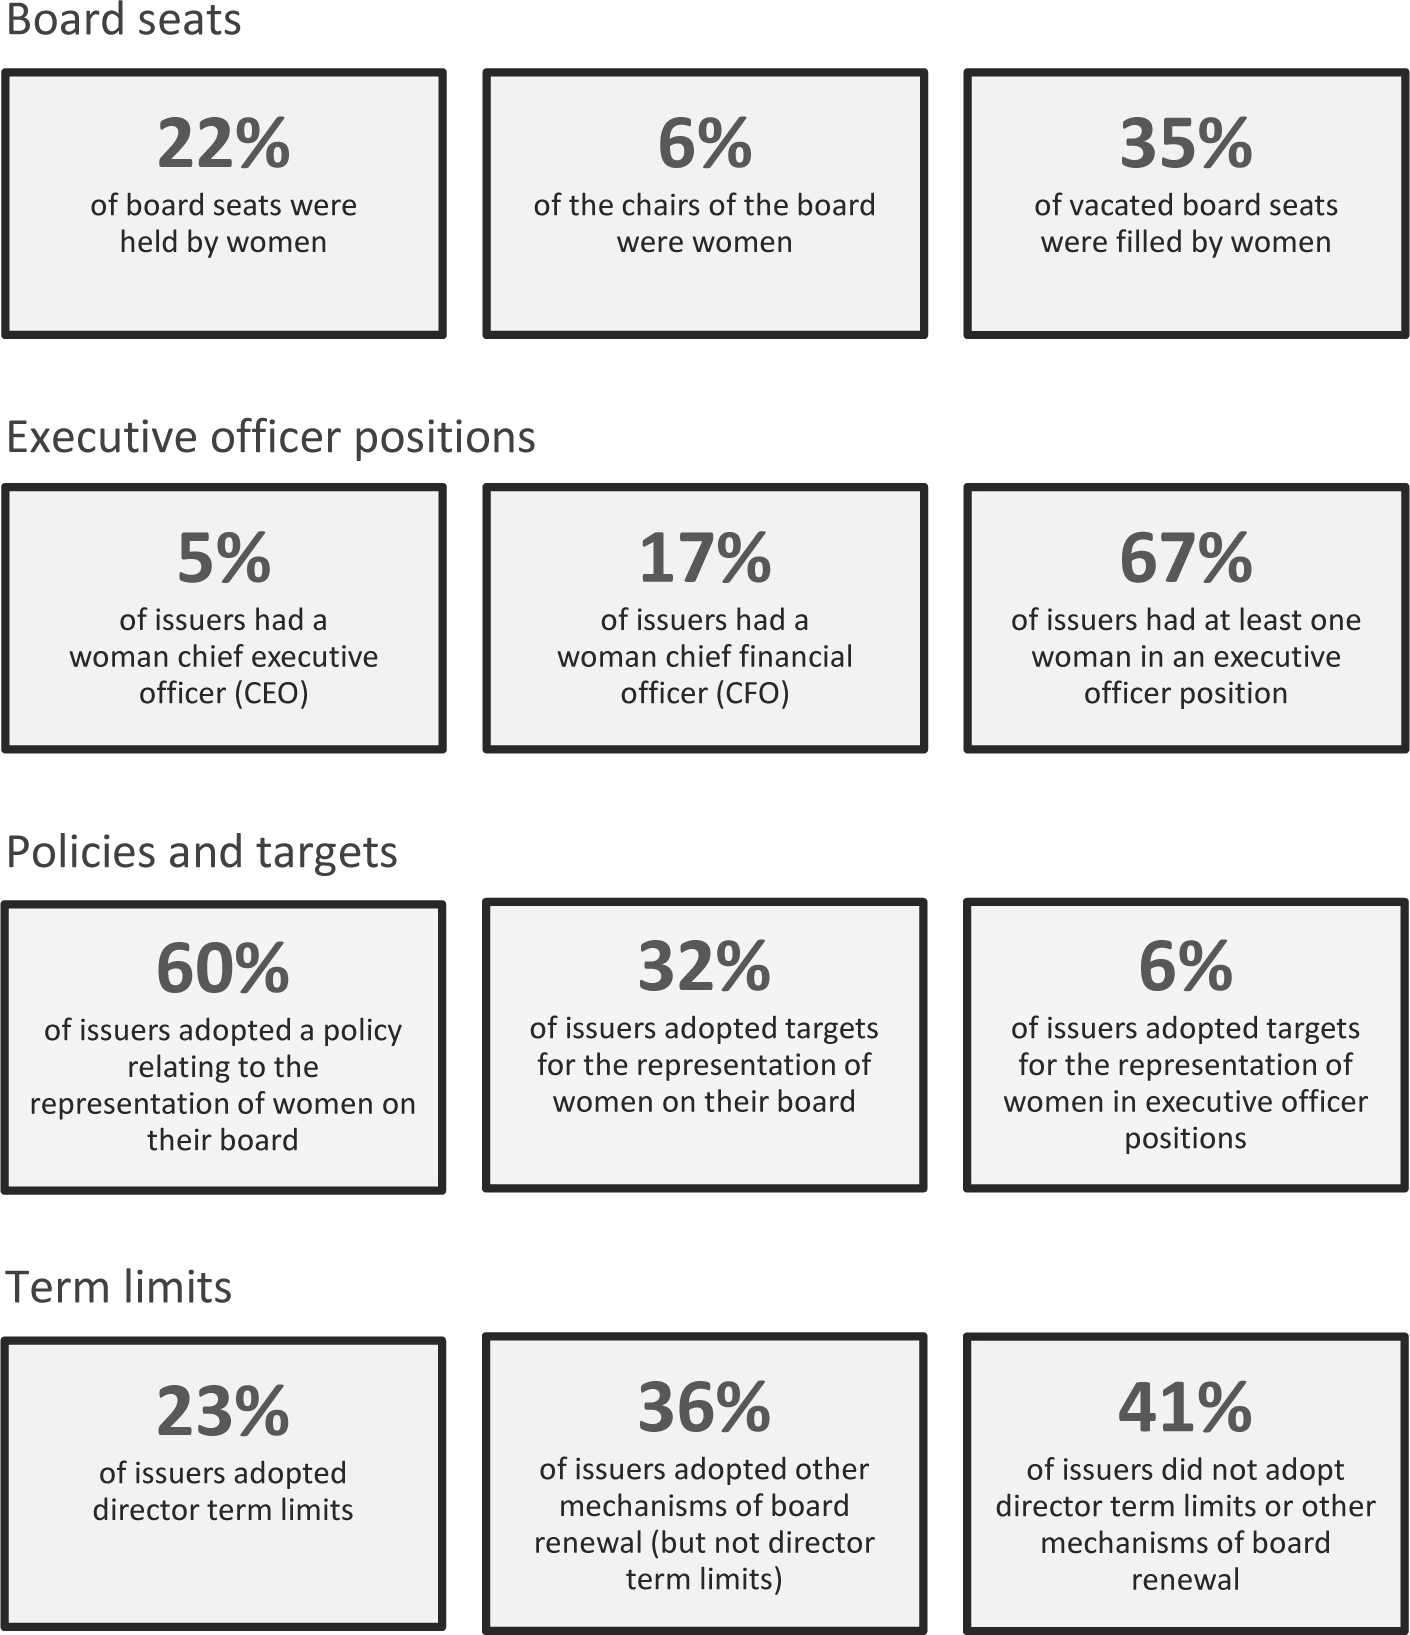
Highlights of review findings at a glance
Disclosure review
Purpose of report
This report outlines key findings from a recent review of public disclosure regarding women on boards and in executive officer positions as required by Form 58-101F1 Corporate Governance Disclosure of National Instrument 58-101 Disclosure of Corporate Governance Practices (NI 58-101). This is the seventh consecutive annual review of this disclosure that we have conducted.{1} The review was completed primarily for the purposes of identifying key trends. A qualitative assessment of compliance with the disclosure requirements was not conducted.
Disclosure requirements
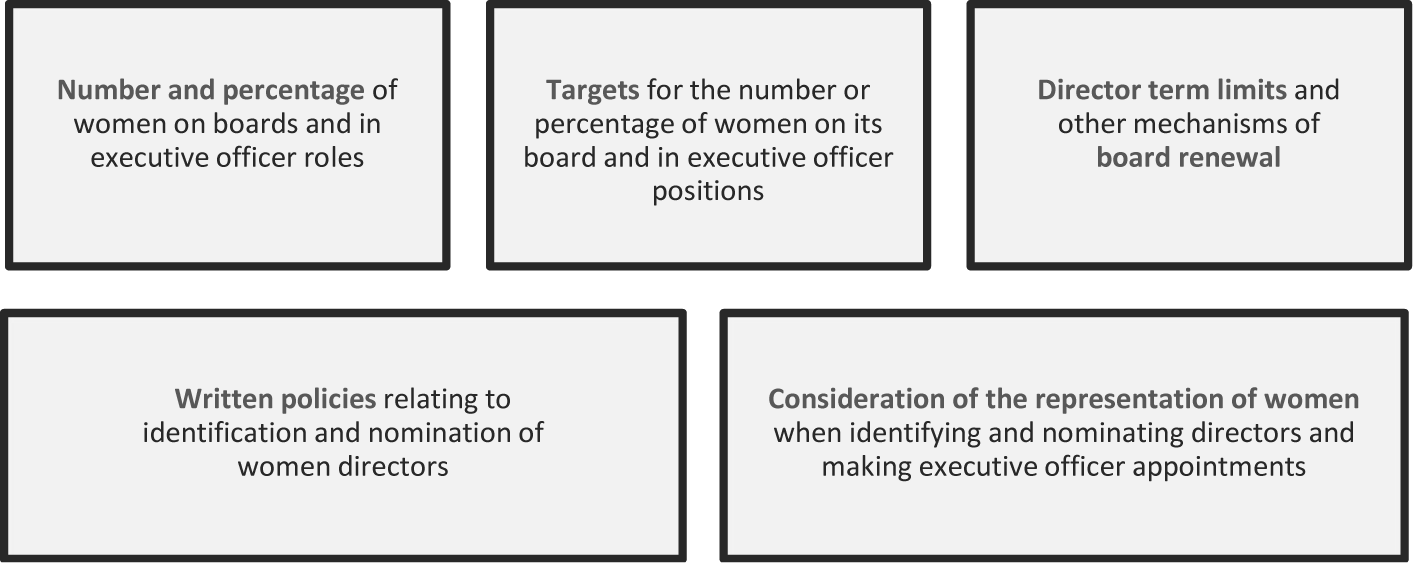
Subject to certain exceptions{2}, issuers listed on the Toronto Stock Exchange (TSX) and other non-venture issuers are required to provide disclosure on an annual basis in the following five areas:
The objective of the disclosure requirements is to increase transparency for investors and other stakeholders regarding the representation of women on boards and in executive officer positions, and the approach that issuers take in respect of such representation.
Review sample
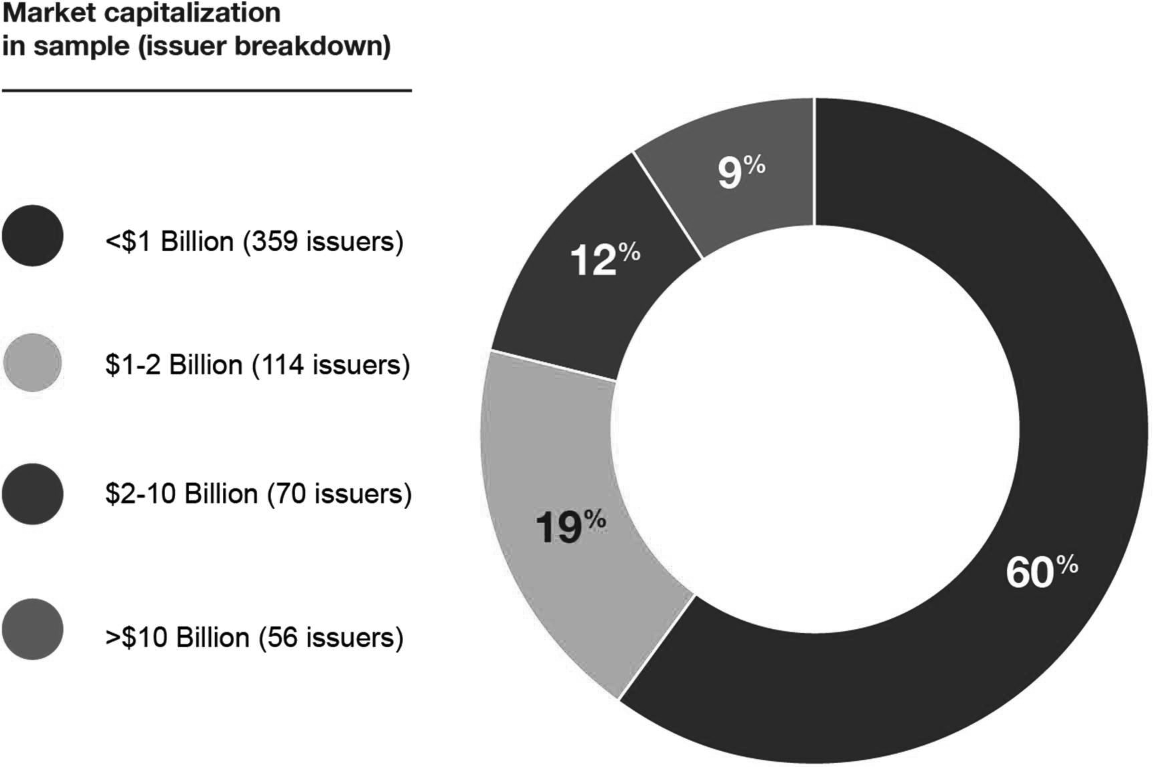
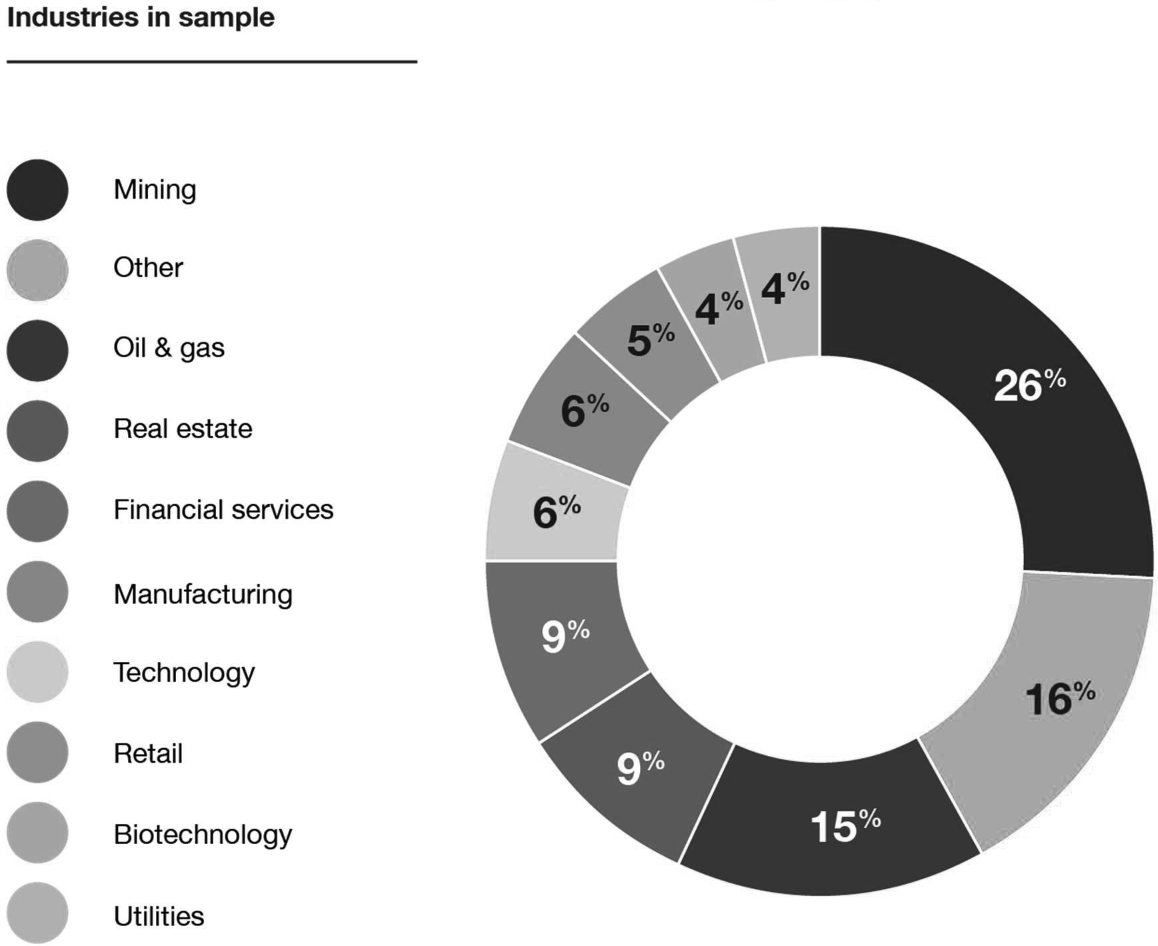
As of May 31, 2021, approximately 1,692 issuers were listed on the TSX, of which approximately 776 were subject to the disclosure requirements. The data summarized in this report is based on a review sample of 599 issuers that had year-ends between December 31, 2020 and March 31, 2021 (Year 7) and filed information circulars or annual information forms by July 31, 2021. A breakdown of the issuers in the review sample by market capitalization and industry is set out in Annex A.
Year-over-year comparison of key trends
The following is a snapshot of the year-over-year comparison of the key trends identified in our reviews{3}:
Trends{4}
Year 1
Year 2
Year 3
Year 4
Year 5
Year 6
Year 7
Board representation
Total board seats occupied by women
11%
12%
14%
15%
17%
20%
22%
Chairs of the board who are women
--
--
--
--
5%
6%
6%
Board vacancies filled by women
--
--
26%
29%
33%
30%
35%
Issuers with at least one woman on their board
49%
55%
61%
66%
73%
79%
82%
Issuers with three or more women on their board
8%
10%
11%
13%
15%
20%
24%
Board seats occupied by women for issuers with < $1 billion market capitalization
8%
9%
10%
11%
13%
15%
16%
Board seats occupied by women for issuers with $1-2 billion market capitalization
11%
13%
17%
19%
20%
24%
24%
Board seats occupied by women for issuers with $2-10 billion market capitalization
17%
18%
18%
21%
23%
26%
28%
Board seats occupied by women for issuers with over $10 billion market capitalization
21%
23%
24%
25%
27%
31%
30%
{4} Where a percentage is not identified in this table for a particular trend in a specific year, it is generally because that trend was not included in our reporting during that year's review process.
|
Trends{5} |
Year 1 |
Year 2 |
Year 3 |
Year 4 |
Year 5 |
Year 6 |
Year 7 |
|
|
|||||||
|
Executive officers |
|||||||
|
|
|||||||
|
Issuers with at least one woman in an executive officer position{6} |
60% |
59% |
62% |
66% |
64% |
65% |
67% |
|
|
|||||||
|
Issuers with a woman CEO |
-- |
-- |
-- |
4% |
4% |
5% |
5% |
|
|
|||||||
|
Issuers with a woman CFO |
-- |
-- |
-- |
14% |
15% |
15% |
17% |
|
|
|||||||
|
Policies |
|||||||
|
|
|||||||
|
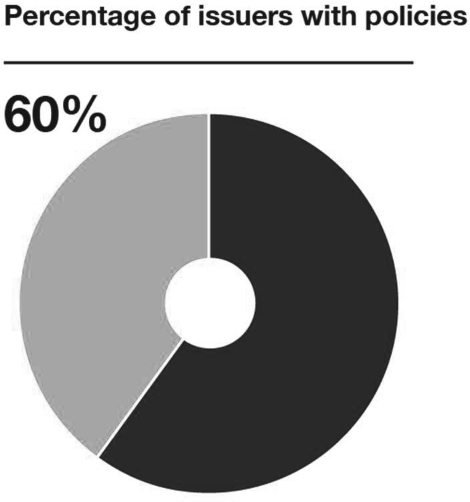
Issuers that adopted a policy relating to the representation of women on their board |
15% |
21% |
35% |
42% |
50% |
54% |
60% |
|
|
|||||||
|
Targets |
|||||||
|
|
|||||||
|
Issuers that adopted targets for the representation of women on their board |
7% |
9% |
11% |
16% |
22% |
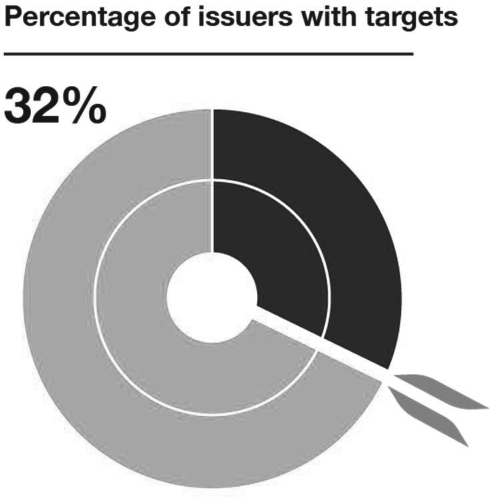
26% |
32% |
|
|
|||||||
|
Issuers that adopted targets for the representation of women in executive officer positions{5} |
2% |
2% |
3% |
4% |
3% |
4% |
6% |
|
|
|||||||
|
Term limits |
|||||||
|
|
|||||||
|
Issuers that adopted director term limits |
19% |
20% |
21% |
21% |
21% |
23% |
23% |
{5} Where a percentage is not identified in this table for a particular trend in a specific year, it is generally because that trend was not included in our reporting during that year's review process.
{6} The decrease in year 5 is driven in part by a change in methodology used to capture executive officer data. Issuers may have included in their disclosure, positions and/or targets for a group other than executive officers, as that term is defined in NI 58-101. In year 5, we focused more closely on disclosure regarding "executive officers" as defined.
Board seat findings
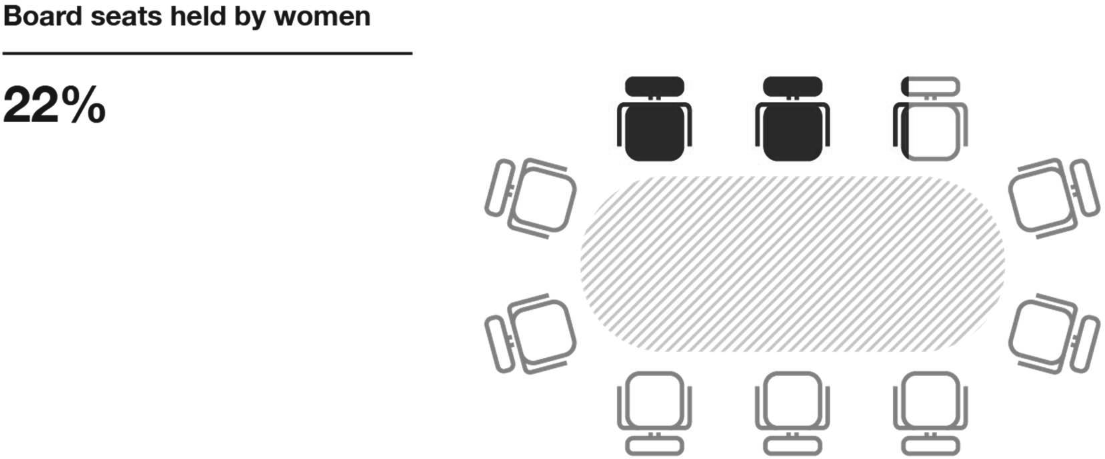
The percentage of board seats held by women increased from 11% in year 1 to 22% in year 7.
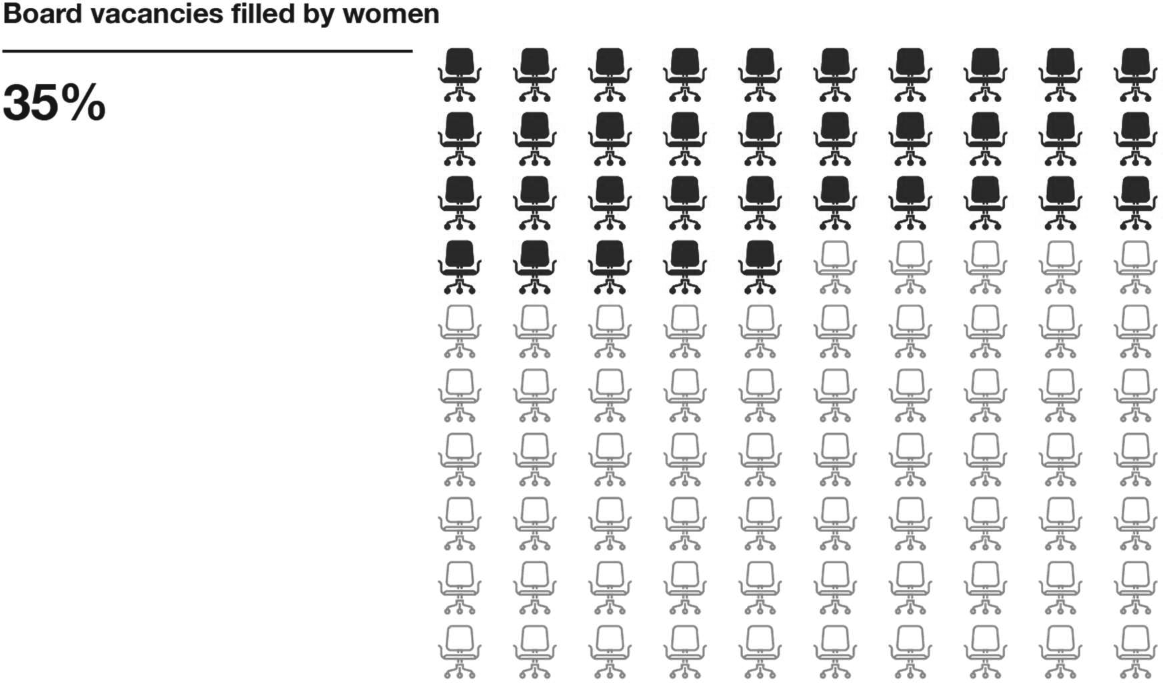
This year, 665 board seats were vacated during the year and 555 of those seats were filled. Of those filled seats, approximately 35% (197 seats) were filled by women which represents a 5% increase over year 6.
Other notable findings
Variation among industries
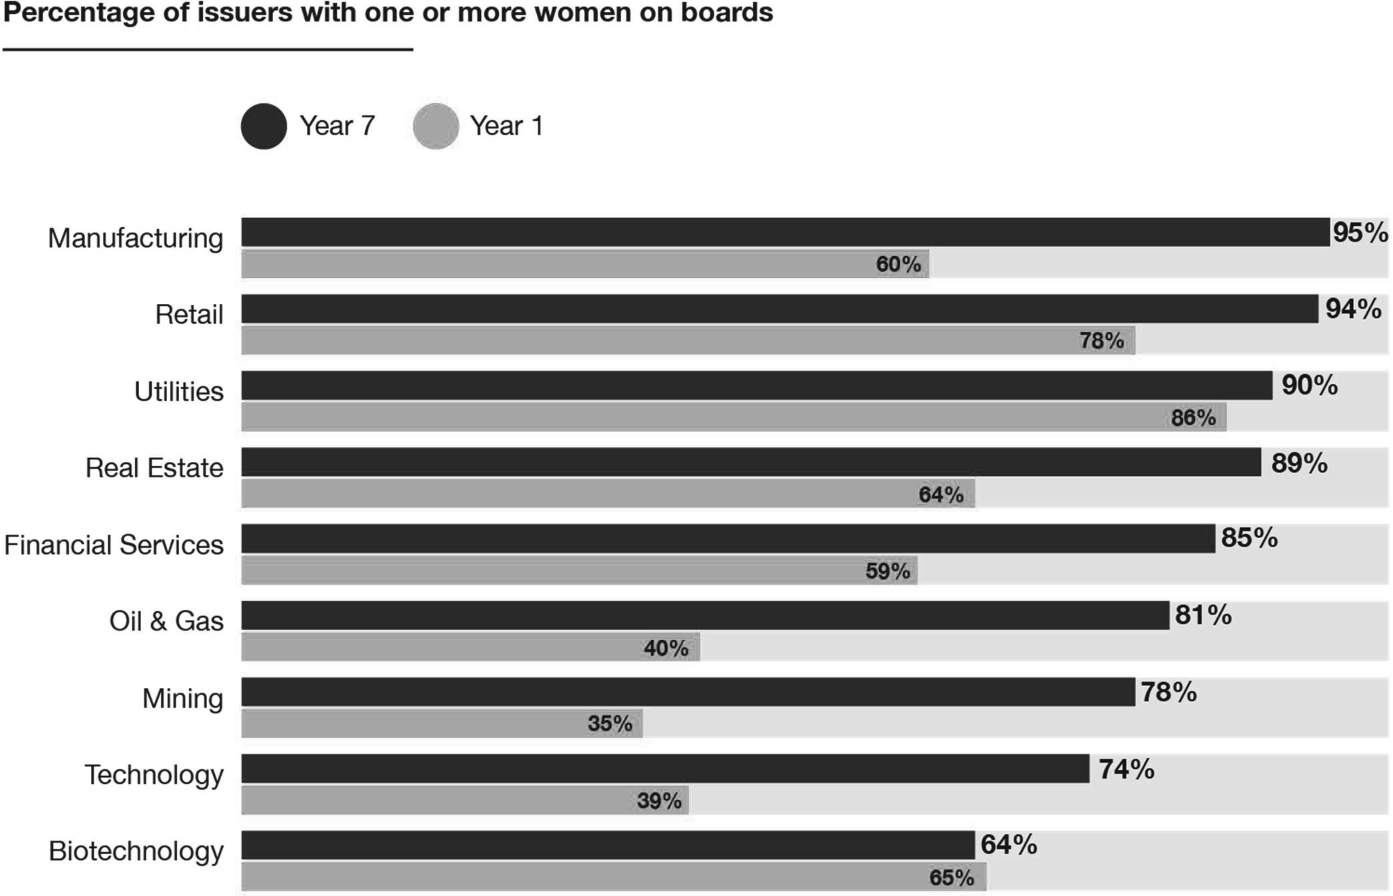
The number of women on boards varied by industry. The manufacturing, retail and utilities industries had the highest percentage of issuers with one or more women on their boards.{7} The biotechnology, technology and mining industries had the lowest percentage of issuers with one or more women on their boards.
Refer to Annex B for a year-over-year comparison of the percentage of issuers with one or more women on their boards by industry.
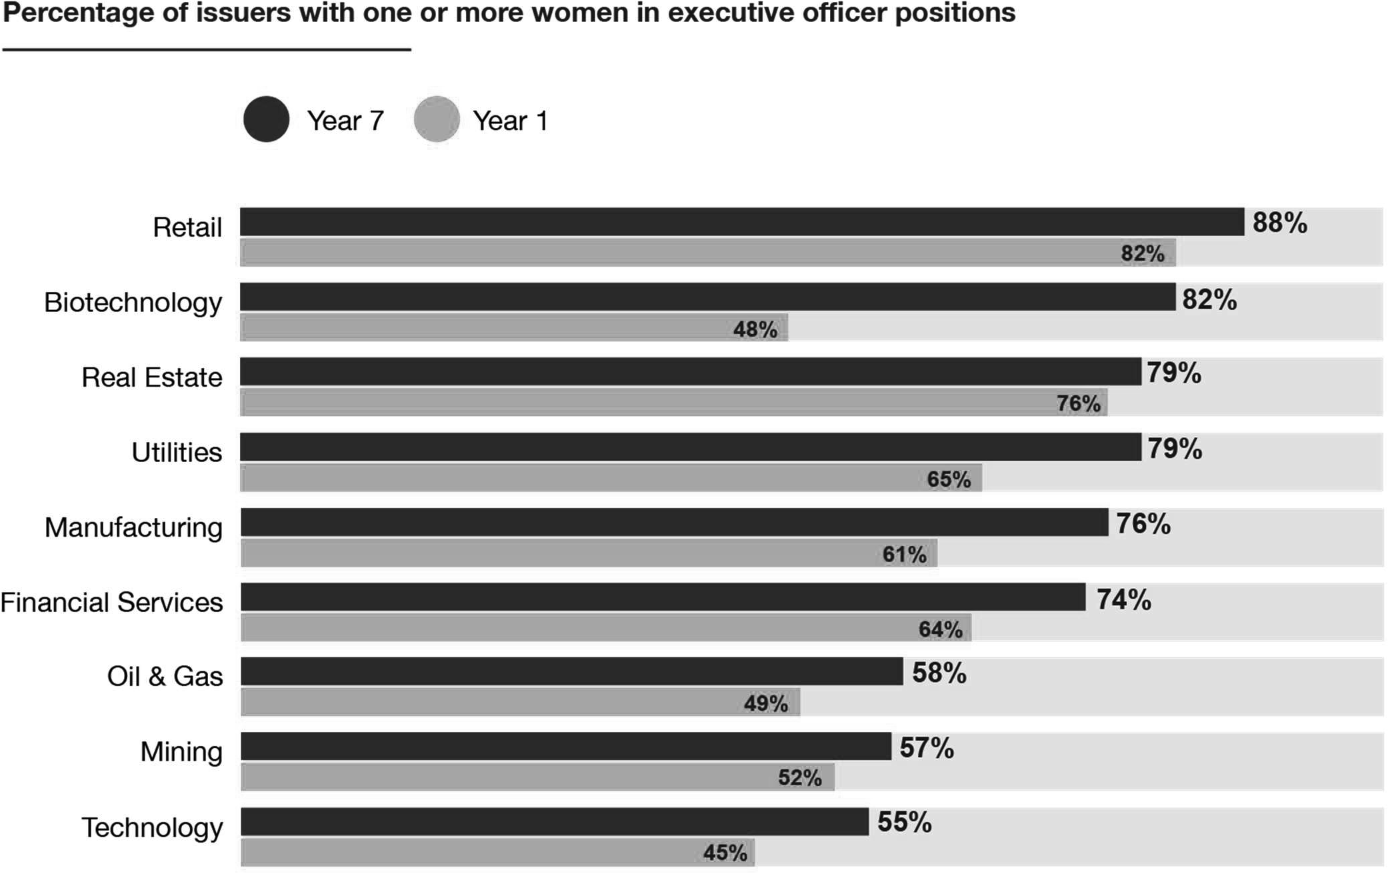
The number of women in executive officer positions also varied by industry. The retail, biotechnology, real estate and utilities industries had the highest percentage of issuers with one or more women in executive officer positions. The technology, mining and oil & gas industries had the lowest percentage of issuers with one or more women in executive officer positions.
Refer to Annex C for a year-over-year comparison of the percentage of issuers with one or more women in executive officer positions by industry.
Diversity measures and board seats held by women
There was a correlation between issuers adopting certain diversity measures and the proportion of board seats held by women.
- - - - - - - - - - - - - - - - - - - -
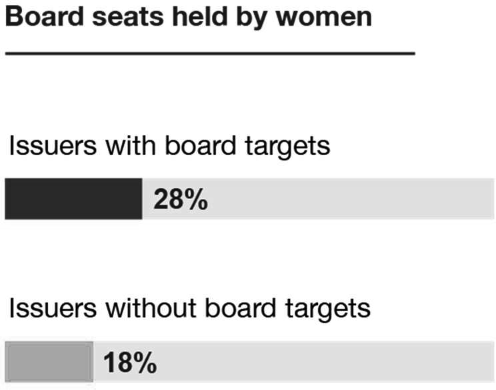
Issuers who set targets for the representation of women on their boards had a greater proportion of board seats held by women. Issuers that adopted board targets had an average of 28% of their board seats held by women, compared to 18% for issuers without targets.
- - - - - - - - - - - - - - - - - - - -
- - - - - - - - - - - - - - - - - - - -
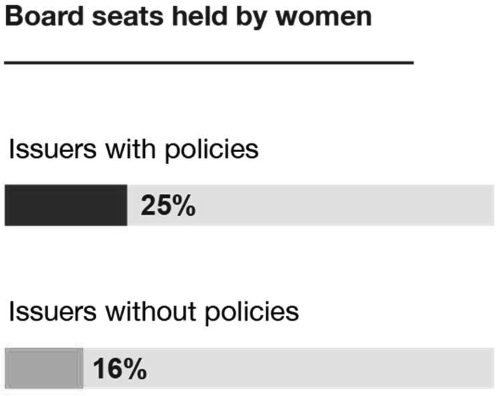
Issuers that adopted a written policy relating to the representation of women on their board also tended to have a greater proportion of board seats held by women. Issuers that adopted a policy relating to the representation of women on their boards had an average of 25% of women on their boards, compared to 16% for issuers with no such policy.
- - - - - - - - - - - - - - - - - - - -
Term limits
Of the 23% of issuers we reviewed that had adopted director term limits, 41% adopted age limits alone, 29% adopted tenure limits alone, and 30% adopted both age and tenure limits.
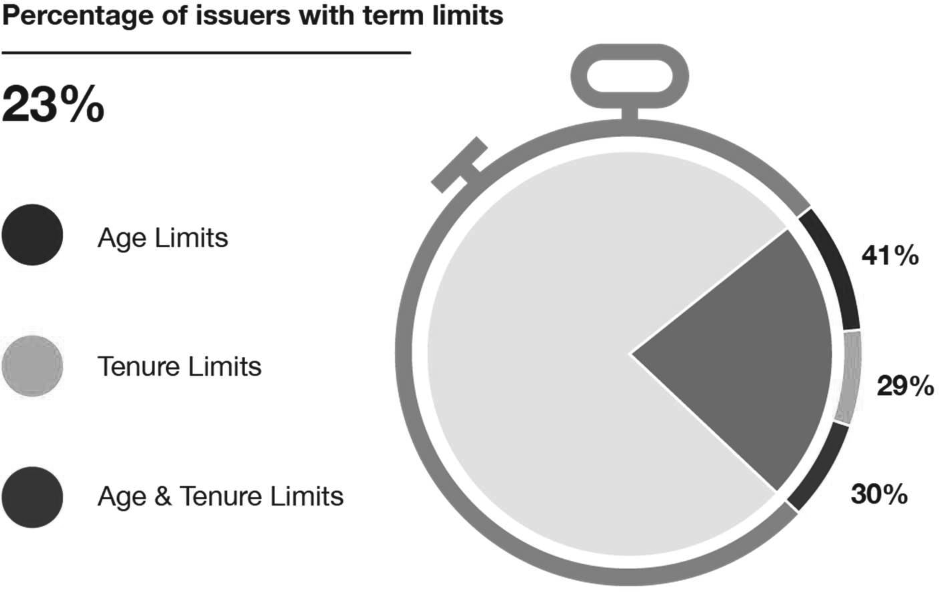
Issuers that adopted term limits had an average of 28% of women on their boards, compared to 19% for issuers with no term limits.
Guidance Related to Disclosure Practices
During our review, we noted that issuers generally provide disclosure addressing the disclosure requirements in different ways. As a result of this, the format and content of disclosure may vary from issuer to issuer. It may also be difficult to locate the relevant disclosure within an information circular and it may be difficult to interpret some of the disclosure.
In order to address this, issuers should consider presenting data related to the disclosure requirements in a common format. This would improve consistency and comparability and help investors identify and evaluate the relevant disclosure in an efficient manner.
The following is an illustrative example of a format that issuers could use in their information circulars (or other applicable disclosure documents) to provide certain data responsive to the disclosure requirements. We have inserted data (or responses) as illustrations only.
Data regarding women on boards and in executive officer positions
Item 15 of Form 58-101F1 requires an issuer to disclose: the number and proportion (in percentage terms) of directors on the issuer's board who are women. the number and proportion (in percentage terms) of executive officers of the issuer, including all major subsidiaries of the issuer, who are women.
This information could be presented as follows (with data included below as an illustration).
|
|
[insert year] |
|
|
|
||
|
|
Number |
% |
|
|
||
|
Women on board of directors |
3 |
30% |
|
|
||
|
Women in executive officer positions |
3 |
37.5% |
Information regarding targets
Item 14 of Form 58-101F1 requires an issuer to disclose:
• whether the issuer has adopted a target regarding women on the issuer's board,
• whether the issuer has adopted a target regarding women in executive officer positions of the issuer.
A "target" means a number or percentage, or a range of numbers or percentages, adopted by the issuer of women on the issuer's board or in executive officer positions of the issuer by a specific date.
If the issuer has not adopted these targets, it must disclose why it has not done so. If the issuer has adopted a target, it must disclose:
• the target, and
• the annual and cumulative progress of the issuer in achieving the target.
This information could be presented as follows (with data and information included below as an illustration).
|
|
Target |
Specific date for achievement of target |
Progress in achieving target |
|
|
|
||||
|
|
Number |
% |
|
|
|
|
||||
|
Board of directors |
N/A |
30% |
2023 |
The target has not yet been achieved. Women represent 20% of the directors as of the date of the circular. |
|
|
||||
|
Executive officer positions |
N/A |
N/A |
N/A |
N/A |
If the issuer has not adopted a target, it must include an explanation for why it has not done so.
Information regarding terms limits and other mechanisms of board renewal
Item 10 of Form 58-101F1 requires an issuer to disclose whether or not the issuer has adopted term limits for the directors on its board or other mechanisms of board renewal and if so, include a description of those director term limits or other mechanisms of board renewal.
If the issuer has not adopted director term limits or other mechanisms of board renewal, disclose why it has not done so.
This information could be presented as follows (with data and information included below as an illustration).
|
Director Term Limits |
Other Mechanisms for Board Renewal |
|
|
|
||
|
Age Limit |
Tenure Limit |
|
|
|
||
|
No |
Yes -- 12 years |
No other mechanisms for board renewal adopted. |
Questions
If you have any questions regarding this report, please contact:
Ontario Securities Commission
Jo-Anne Matear
Jonathan Blackwell
416-593-2323
416-593-8138
Leslie Milroy
Aisha Suleman
416-596-4272
416-593-2324
Alberta Securities Commission
Rebecca Moen
Jennifer Smith
403-297-4846
403-355-3898
Financial and Consumer Affairs Authority of Saskatchewan
Heather Kuchuran
306-787-1009
The Manitoba Securities Commission
Wayne Bridgeman
204-945-4905
Autorité des marchés financiers
Martin Latulippe
514-395-0337, ext.4331
Financial and Consumer Services Commission (New Brunswick)
Ella-Jane Loomis
506-453-6591
Nova Scotia Securities Commission
Valerie Tracy
902-424-5718
{1} The trends from our first six annual reviews are set out in CSA Multilateral Staff Notices 58-307 (year 1), 58-308 (year 2), 58-309 (year 3), 58-310 (year 4), 58-311 (year 5) and 58-312 (year 6).
{2} Certain TSX listed issuers, such as exchange traded funds, closed-end funds, designated foreign issuers and SEC foreign issuers are not subject to the disclosure requirements.
{3} Due to the scope of our sample, our findings, and the comparisons between the current year and the prior six years provide only a partial picture. The issuers in the current year and the prior year samples vary for several reasons including:
• issuers being delisted from the TSX,
• issuers' listings of securities being moved to the TSX-V,
• corporate reorganizations resulting in issuers no longer being listed on the TSX,
• issuers filing information circulars after November 30, 2020 (Year 6) or July 31, 2021 (Year 7),
• issuers completing initial public offerings and becoming listed on the TSX, and
• issuers ceasing to be reporting issuers.
{7} The larger Canadian banks, which are part of an industry that has generally been an early adopter of diversity initiatives, are not captured in the data sample for this review.
Annex A
Annex B
The following is a year-over-year comparison of the percentage of issuers with at least one woman on their board by industry:
|
Industry |
Year 1 |
Year 2 |
Year 3 |
Year 4 |
Year 5 |
Year 6 |
Year 7 |
|
|
|||||||
|
Biotechnology |
65% |
57% |
56% |
56% |
67% |
59% |
64% |
|
|
|||||||
|
Financial Services |
59% |
67% |
60% |
61% |
73% |
77% |
85% |
|
|
|||||||
|
Manufacturing |
60% |
68% |
84% |
89% |
93% |
93% |
95% |
|
|
|||||||
|
Mining |
35% |
38% |
54% |
59% |
62% |
72% |
78% |
|
|
|||||||
|
Oil & Gas |
40% |
40% |
45% |
56% |
70% |
73% |
81% |
|
|
|||||||
|
Real Estate |
64% |
66% |
59% |
73% |
80% |
90% |
89% |
|
|
|||||||
|
Retail |
78% |
79% |
89% |
84% |
86% |
91% |
94% |
|
|
|||||||
|
Technology |
39% |
52% |
52% |
68% |
73% |
84% |
74% |
|
|
|||||||
|
Utilities |
86% |
82% |
86% |
81% |
85% |
87% |
90% |
Annex C
The following is a year-over-year comparison of the percentage of issuers with at least one woman in an executive officer position by industry:
|
Industry |
Year 1 |
Year 2 |
Year 3 |
Year 4 |
Year 5 |
Year 6 |
Year 7 |
|
|
|||||||
|
Biotechnology |
48% |
66% |
71% |
64% |
61% |
73% |
82% |
|
|
|||||||
|
Financial Services |
64% |
63% |
66% |
71% |
76% |
71% |
74% |
|
|
|||||||
|
Manufacturing |
61% |
81% |
79% |
80% |
70% |
74% |
76% |
|
|
|||||||
|
Mining |
52% |
49% |
52% |
56% |
52% |
52% |
57% |
|
|
|||||||
|
Oil & Gas |
49% |
46% |
48% |
53% |
54% |
58% |
58% |
|
|
|||||||
|
Real Estate |
76% |
76% |
80% |
80% |
83% |
79% |
79% |
|
|
|||||||
|
Retail |
82% |
71% |
68% |
76% |
80% |
78% |
88% |
|
|
|||||||
|
Technology |
45% |
44% |
59% |
52% |
55% |
68% |
55% |
|
|
|||||||
|
Utilities |
65% |
73% |
67% |
75% |
70% |
75% |
79% |